
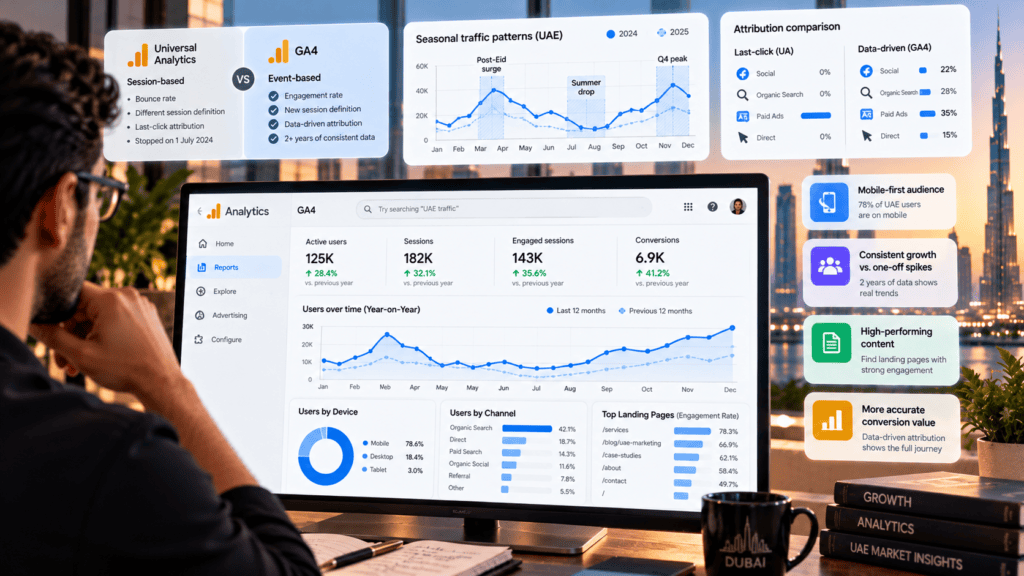
Universal Analytics stopped processing data on July 1, 2024. Since then, GA4 has been the only version of Google Analytics that runs. For most UAE businesses, this means they now have at least two full years of data collected in a consistent system, enough to run genuine year-over-year comparisons, identify trends rather than snapshots, and spot patterns that a single month’s data cannot reveal.
The majority of UAE businesses have not used this data as the longitudinal resource it now is. They are still pulling monthly reports, comparing this month to last month, and using the data to answer the question of whether things are better or worse right now. The more valuable questions, the ones two years of consistent data can now answer, are going largely unasked.
This article covers what those questions are and what the data tends to reveal when UAE service businesses look at it properly.
Why GA4 and UA Data Cannot Be Compared
Before any other analysis, this needs to be settled: GA4 and Universal Analytics measure sessions, users, and conversions using fundamentally different definitions. Comparing your current GA4 traffic to your UA-era traffic produces a methodology comparison, not a performance comparison.
GA4 is event-based. UA was session-based. A session in UA ended after 30 minutes of inactivity and restarted when a user returned. In GA4, sessions are defined differently. GA4’s engagement rate replaces UA’s bounce rate but does not calculate the same way. Attribution models differ between the two systems.
This means every statement like “traffic is down 23% since the same period two years ago” that compares GA4 data to UA data is comparing two different measurement instruments and calling it a trend. The comparison is noise.
Within GA4, comparing this October to last October in the same system, with the same definitions applied consistently, produces something you can actually use.
The Year-on-Year Questions Worth Asking
Two years of consistent GA4 data makes these questions answerable for the first time for most UAE businesses:
What does your UAE seasonal curve actually look like? The post-Eid surge, the summer traffic drop, the Ramadan hour-shift, the Q4 B2B activity peak: these patterns are real and consistent, but they only become visible as patterns once you have two cycles of data to compare. A business reading only the current month’s data cannot distinguish a temporary dip from a consistent seasonal behaviour.
Which acquisition channels show consistent growth versus one-off spikes? A traffic spike from a specific campaign in June 2024 looks meaningfully different in a two-year view from a slow, consistent organic traffic build that started six months earlier and has continued. Monthly reporting flattens this into current-period numbers.
How has your mobile-to-desktop split changed? UAE audiences are overwhelmingly mobile-first, but the ratio and behaviour patterns shift over time. A business that has not looked at this over 24 months may be making UX and CTA decisions based on device assumptions that no longer reflect how its actual audience browses.
Which landing pages have consistently high engagement versus consistently thin engagement? A single month of data gives you a sample. Two years gives you a pattern. Pages with consistently low engagement rates across every month of data deserve a closer look than pages that had a bad October.
What GA4’s Engagement Rate Actually Measures
The switch from UA’s bounce rate to GA4’s engagement rate is one of the most consequential metric changes for how UAE businesses read their website performance.
UA’s bounce rate: the percentage of sessions where the visitor viewed only one page and left. A visitor who loaded your services page, spent four minutes reading it, and then left without clicking further was counted as a bounce. This made single-page visits look like failures regardless of how engaged the visitor actually was.
GA4’s engagement rate: the percentage of sessions that lasted more than 10 seconds, included a conversion event, or included at least two pageviews. That same four-minute single-page visitor is now counted as an engaged session.
For UAE service websites where a visitor commonly lands on a services page, reads it thoroughly, and then converts via WhatsApp rather than by clicking to another page, this change is significant. Engagement rates in GA4 for such pages will be notably higher than bounce rates for the same pages in UA. This is not traffic improvement. It is more accurate measurement of the same behaviour.
If two years of GA4 data reveals consistent underperformance across multiple channels, a structured marketing audit is the right next step, how to audit your UAE digital marketing and find what is broken provides the diagnostic framework that makes GA4 insights actionable across the full marketing picture.
The Attribution Model Shift
GA4 defaults to data-driven attribution. UA defaulted to last-click. This change affects which channels appear to be driving value in your reports.
Under last-click attribution, the final touchpoint before conversion gets 100% of the credit. A UAE buyer who found your agency through a LinkedIn article, returned via branded Google search three weeks later, and then converted after clicking a remarketing ad would have their conversion attributed entirely to the remarketing ad.
Under data-driven attribution, GA4 distributes conversion credit across all touchpoints in proportion to their modelled contribution. The LinkedIn article gets credit. The branded search gets credit. The remarketing ad gets credit.
For UAE service businesses with multi-session, multi-channel conversion journeys, data-driven attribution typically shows organic social and brand awareness channels contributing more conversion value than last-click models showed. If your current data-driven attribution reports are showing LinkedIn or organic search contributing more than you expected, the model is probably more accurate, not more generous.
FAQ
My GA4 numbers are lower than my old UA numbers for the same period. Has traffic actually dropped? Not necessarily. GA4 and UA count sessions differently. Lower GA4 session counts compared to UA for the same period are a measurement method difference, not a traffic decline. Compare GA4 to GA4 for accurate performance assessment.
How do I build a year-on-year comparison in GA4? In the standard GA4 reporting interface, use the date range selector and set the comparison to “previous year.” This overlays the same period from the previous year against your current selection. For more flexible analysis, Google Looker Studio connected to your GA4 property gives better year-on-year visualisation tools.
What conversion events should my UAE service business be tracking? At minimum: WhatsApp button clicks, phone number clicks (where the number is a tappable link), email link clicks, and form submissions. If your website includes a Google Business Profile link or any direction to your physical location, track those as events too. Without these tracked, GA4 is measuring sessions and behaviour without knowing which sessions ended in commercial intent.
The Data Is Already There
The two years of GA4 data most UAE businesses have already collected is the least-used asset in their analytics stack. They have been pulling monthly snapshots from a longitudinal dataset and treating it as a point-in-time report.
Building a year-on-year dashboard for UAE-origin traffic, segmented by acquisition channel and device type, and reviewing it quarterly is a significantly higher-value use of GA4 than the standard monthly sessions report. How poor website UX is costing UAE businesses qualified leads and how to improve website conversion rate for UAE service businesses cover the website performance changes that GA4 data most commonly surfaces as improvement opportunities. And AI chat widgets on UAE websites and whether they help or hurt enquiry rates is where GA4 event tracking becomes the diagnostic tool for one of the most common UA-era assumptions that the better data now calls into question.
A website design company in UAE presenting clients with a post-launch performance review should be using GA4 year-on-year comparisons rather than month-on-month snapshots. A digital marketing for UAE service businesses strategy built on two years of actual GA4 data is built on something. A strategy built on monthly snapshots is built on noise.